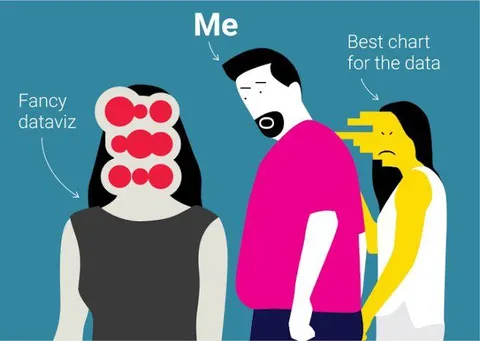
Me Choosing the Best Chart
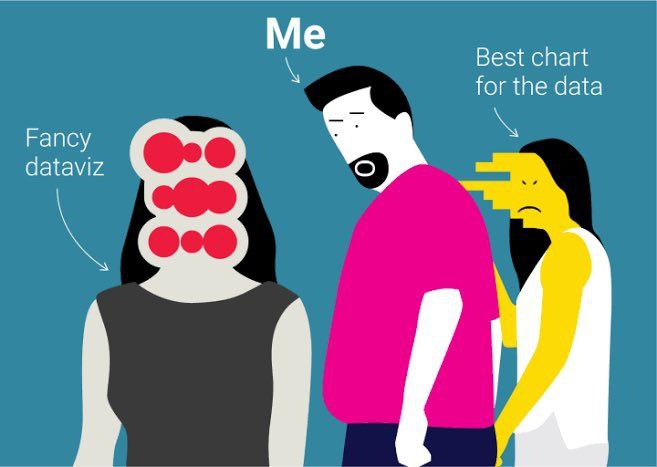
Me Fancy dataviz Best chart for the data
An illustrated man labeled “Me” ignores a woman representing fancy data visualization and turns toward a simpler woman labeled “Best chart for the data.” The joke mocks choosing an appropriate, effective chart over flashy or unnecessarily elaborate visualizations. It is used as a reaction to praise clarity, practicality, and data-driven design.
man in pink shirt / мужчина в розовой рубашкеwoman in black dress / женщина в чёрном платьеwoman in yellow and white clothes / женщина в жёлто-белой одеждеdata visualization / визуализация данныхchart / диаграммаred circles / красные кругиblack hair / чёрные волосыwhite background shapes / белые фоновые фигурыblue background / синий фонbeard / бородаglasses-like circles / круги, похожие на очкиpointing arrows / стрелки-указатели
- @profunctor_io / 3187 2019-10-10
- Type
- image
- Size
- 657×467 · 35.8 KiB
- Mood
- sarcastic
- Language
- en
- Added