Rainbow Vomit Into Data Charts
Histogram over time
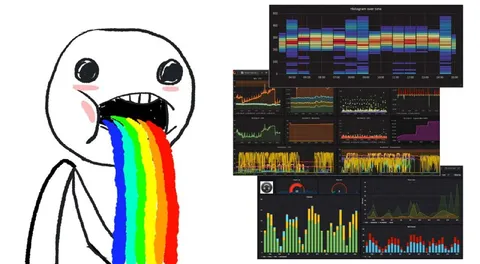
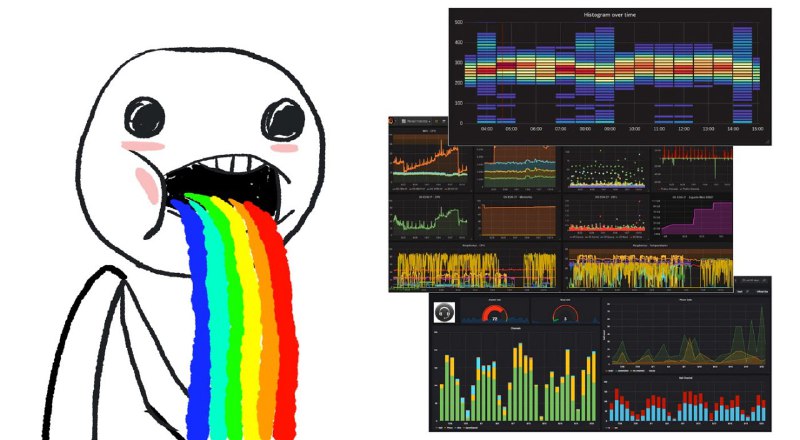
A wide-eyed cartoon figure vomits a bright rainbow onto a wall of colorful monitoring charts and graphs. The joke is that an overwhelming amount of data, metrics, or information is being produced, often used as a reaction to dashboards, analytics, or chaotic statistics. EN: A wide-eyed cartoon figure vomits a bright rainbow onto a wall of colorful monitoring charts and graphs. The joke is that an overwhelming amount of data, metrics, or information is being produced, often used as a reaction to dashboards, analytics, or chaotic statistics.
cartoon person / мультяшный человекwide eyes / широко раскрытые глазаopen mouth / открытый ротrainbow vomit / радужная блевотинаrainbow stream / радужный потокmonitoring dashboard / панель мониторингаdata charts / графики данныхline graphs / линейные графикиbar charts / столбчатые графикиcolored graphs / цветные графикиblack background / чёрный фонwhite cartoon outline / белый мультяшный контурpink cheeks / розовые щёки
- @profunctor_io / 2509 2019-07-06
- Template
- Rainbow Vomit
- Type
- image
- Size
- 800×440 · 69.7 KiB
- Mood
- absurd, overwhelmed
- Language
- en
- Added