Bell Curve Testing Results
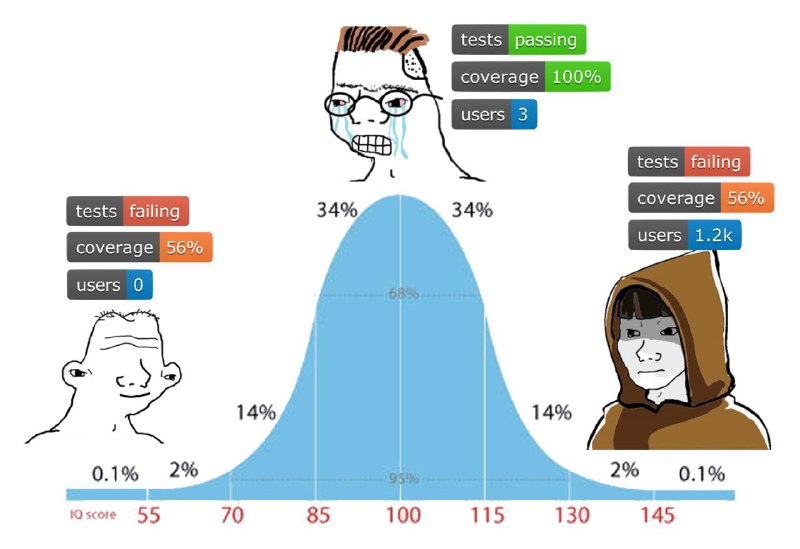
tests passing coverage 100% users 3 tests failing coverage 56% users 0 tests failing coverage 56% users 1.2k 34% 34% 68% 14% 14% 0.1% 2% 2% 0.1% IQ score 55 70 85 100 115 130 145 95%
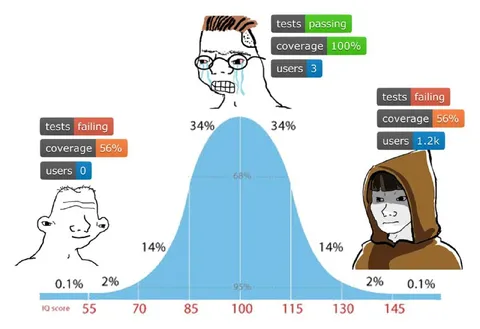
A bell-curve IQ chart compares three testing approaches. The highly educated middle character celebrates passing tests, perfect coverage, and only three users, while the simpler and more experienced extremes show failing tests and imperfect coverage. The joke is that overengineering for a tiny user base is treated as less intelligent than accepting failure at scale.
bell curve chart / график колоколообразной кривойthree Wojak-style characters / три персонажа в стиле Воякаcrying nerd / плачущий ботаникbald simple man / лысый простакhooded man / мужчина в капюшонеround glasses / круглые очкиbrown hood / коричневый капюшонblue chart area / синяя область графикаred axis labels / красные подписи осиgreen status badge / зелёный статусный значокorange status badge / оранжевый статусный значокblue status badge / синий статусный значокsoftware tests / программные тестыcode coverage / покрытие кодаusers / пользователи
- @gentoomemes / 17963 2025-07-22
- @profunctor_io / 11174 2025-10-17
- Template
- IQ Bell Curve
- Type
- image
- Size
- 800×549 · 55.1 KiB
- Mood
- sarcastic
- Language
- en
- Added