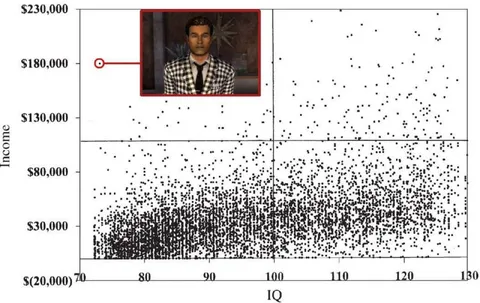
IQ Income Outlier Scatter Plot
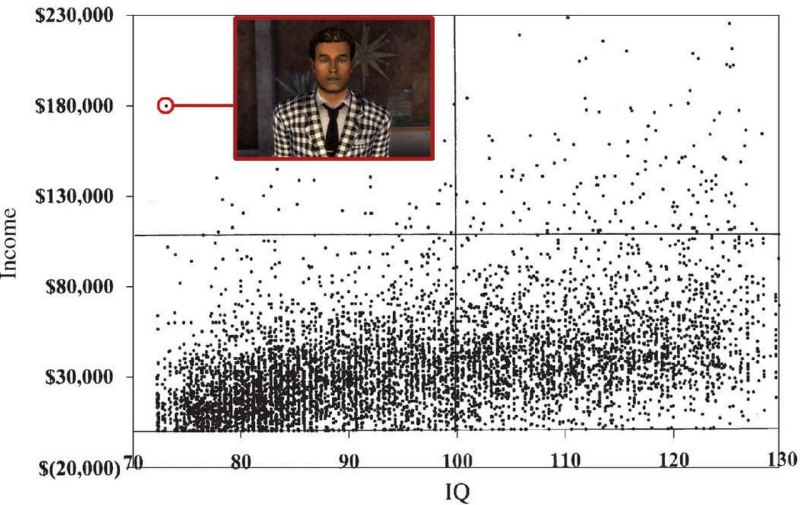
$230,000 $180,000 $130,000 $80,000 $30,000 $(20,000) Income 70 80 90 100 110 120 130 IQ
A scatter plot compares IQ with income, showing a dense cluster of ordinary data points and one highlighted man in a checkered suit at unusually high income. The joke is that the selected person is portrayed as rich despite having an ordinary or low IQ, making it a reaction to someone succeeding in spite of questionable intelligence.
scatter plot / диаграмма рассеянияblack data points / чёрные точки данныхred highlight box / красная рамка выделенияman in checkered suit / мужчина в клетчатом костюмеblack tie / чёрный галстукwhite shirt / белая рубашкаincome axis / ось доходаIQ axis / ось IQchart grid lines / линии сетки графикаindoor background / интерьер на заднем плане
- @jeppa420 / 29493 2023-01-25
- @dustinthehead / 11848 2023-01-26
- Type
- image
- Size
- 800×505 · 92.3 KiB
- Mood
- ironic, absurd
- Language
- en
- Added