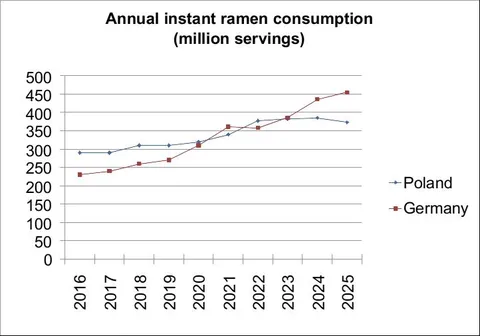
Poland Germany Ramen Consumption Chart
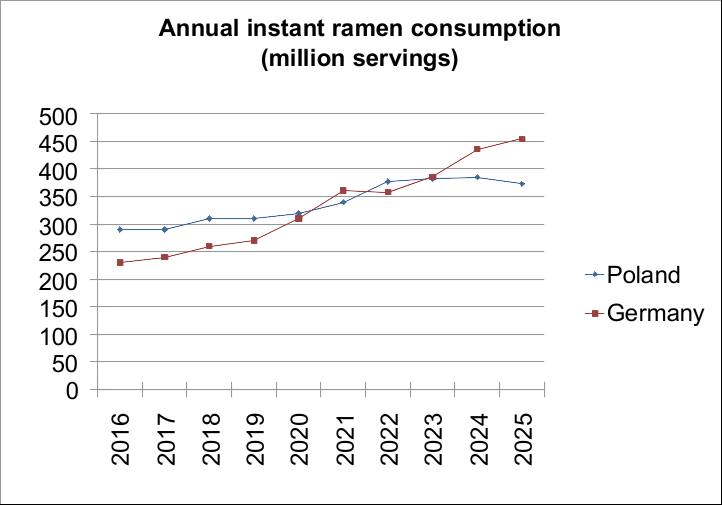
Annual instant ramen consumption (million servings) 500 450 400 350 300 250 200 150 100 50 0 2016 2017 2018 2019 2020 2021 2022 2023 2024 2025 Poland Germany
A line chart compares annual instant ramen consumption in Poland and Germany from 2016 to 2025, measured in million servings. The joke comes from presenting a mundane food-consumption comparison like a dramatic economic trend, with Germany rising past Poland by the end.
line chart / линейный графикinstant ramen / лапша быстрого приготовленияblue line / синяя линияred line / красная линияyear labels / обозначения годовvertical axis / вертикальная осьhorizontal axis / горизонтальная осьdata points / точки данныхchart legend / легенда графикаwhite background / белый фон
- @rzeczyzabawne / 23500 2026-09-20
- Type
- image
- Size
- 722×505 · 32.3 KiB
- Mood
- absurd, ironic
- Language
- en
- Added