GitHub Contribution Graph
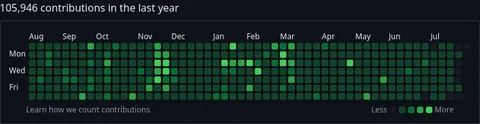
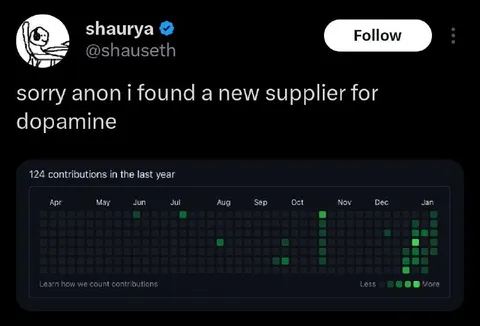
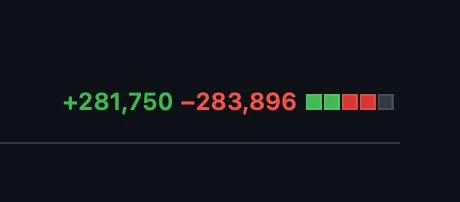
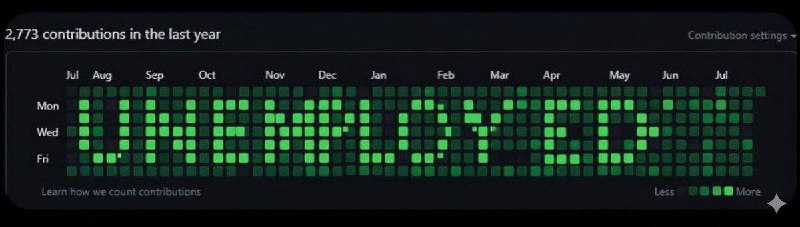
2,773 contributions in the last year
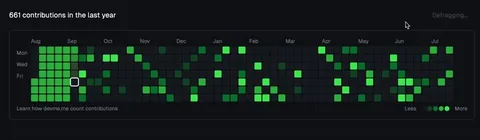
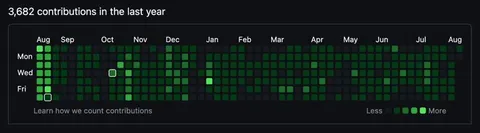
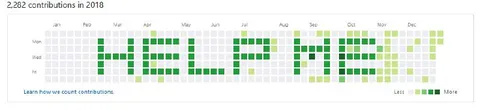
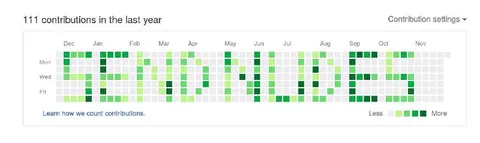
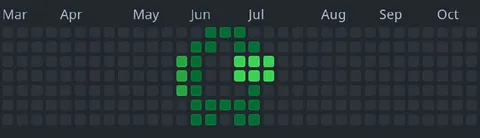
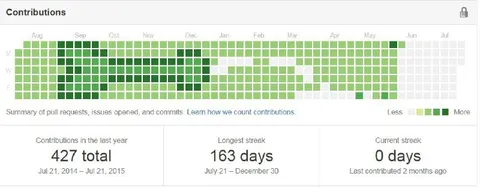
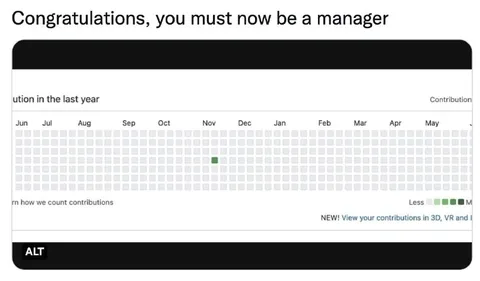
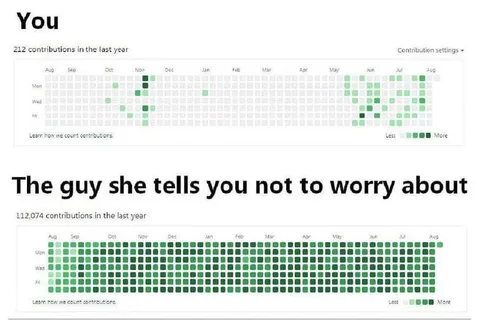
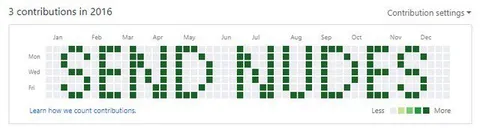
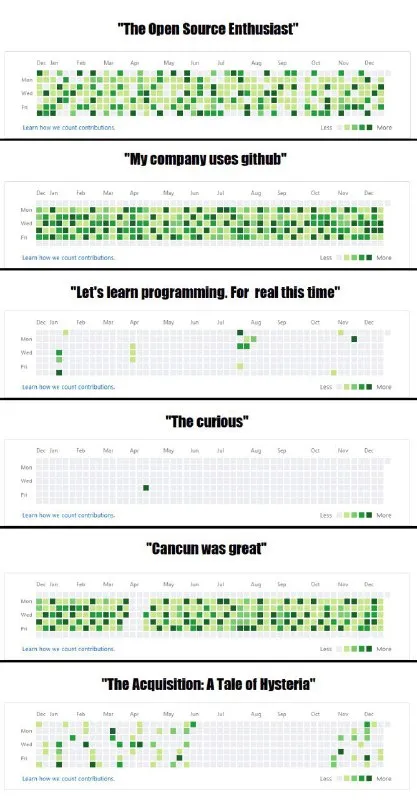
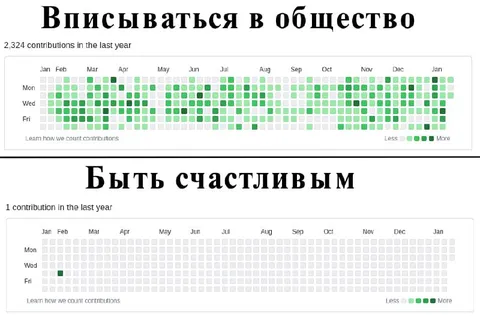
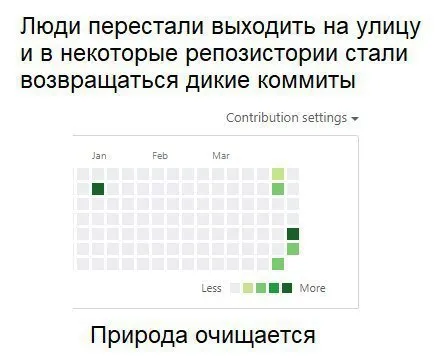
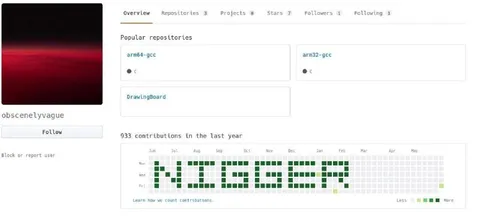
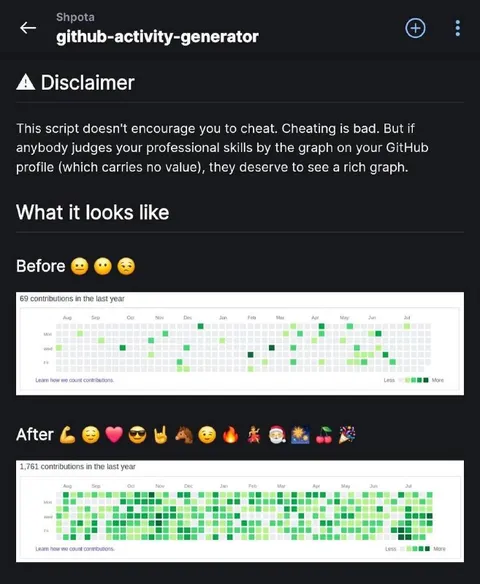
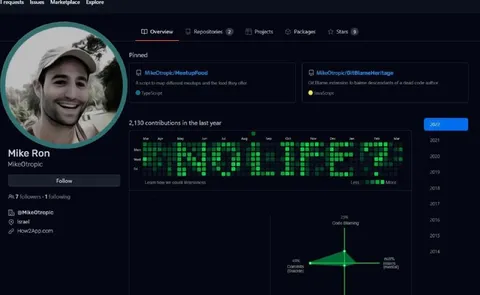
A GitHub contribution graph is filled with green activity squares across the year. The unusually dense pattern humorously presents an intense level of coding activity, often used to joke about overworking, constant programming, or having no life outside GitHub.
- @profunctor_io / 11159 2025-10-12
- Template
- GitHub contribution graph
- Type
- image
- Size
- 800×227 · 37.9 KiB
- Mood
- absurd
- Language
- en
- Added