Linux Performance Observability Tools
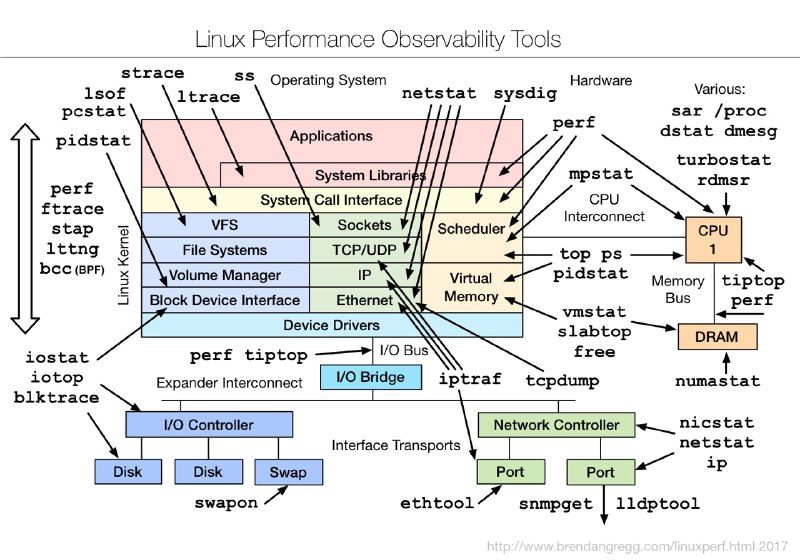
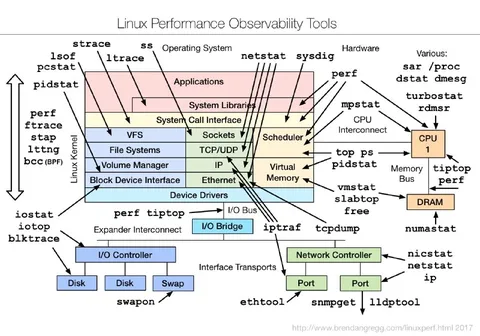
Linux Performance Observability Tools strace ss Operating System lsof 1trace Applications Hardware Various: pcstat pidstat perf System Libraries sar /proc dstat dmesg turbostat rmdsr System Call Interface CPU mpstat VFS Sockets Scheduler perf ftrace stap ltng bcc (BPF) File Systems TCP/UDP IP Virtual Memory top ps pidstat vmstat slabtop free Volume Manager Block Device Interface Ethernet CPU 1 Memory Bus tiptop perf DRAM Device Drivers I/O Bus numastat iostat iotop blktrace perf t iptop I/O Bridge iptraf tcpdump Expander Interconnect I/O Controller Interface Transports Network Controller nicstat netstat Disk Disk Swap Port Port ethtool snmpget lldptool swapon
A layered diagram maps Linux performance observability tools to operating-system components, hardware, storage, networking, and interfaces. The joke is the overwhelming number of specialized command-line tools and the absurd complexity of figuring out which tool observes which subsystem, making it relatable as a reaction to Linux troubleshooting. EN: A layered diagram maps Linux performance observability tools to operating-system components, hardware, storage, networking, and interfaces. The joke is the overwhelming number of specialized command-line tools and the absurd complexity of figuring out which tool observes which subsystem, making it relatable as a reaction to Linux troubleshooting.
technical diagram / техническая диаграммаLinux kernel stack / стек ядра Linuxoperating system layers / уровни операционной системыhardware block / блок оборудованияCPU / центральный процессорDRAM memory / память DRAMmemory bus / шина памятиdisk / дискswap partition / раздел подкачкиnetwork controller / сетевой контроллерI/O controller / контроллер ввода-выводаnetwork ports / сетевые портыfile systems / файловые системыsystem call interface / интерфейс системных вызововscheduler / планировщикvirtual memory / виртуальная памятьTCP/UDP protocols / протоколы TCP/UDPEthernet / Ethernetarrows / стрелкиblue boxes / синие блокиgreen boxes / зелёные блокиorange boxes / оранжевые блоки
#linux#линукс#performance#производительность#observability#наблюдаемость#system administration#системное администрирование#devops#девопс#kernel#ядро#troubleshooting#диагностика#command line#командная строка#monitoring#мониторинг#technical diagram#техническая диаграмма#infographic#инфографика#programming#программирование#systems engineering#системная инженерия#reaction#реакция#meme#мем
- @profunctor_io / 245 2017-07-11
- Type
- image
- Size
- 800×560 · 102.6 KiB
- Mood
- overwhelming, technical
- Language
- en
- Added