Vibe Zone Complexity Graph
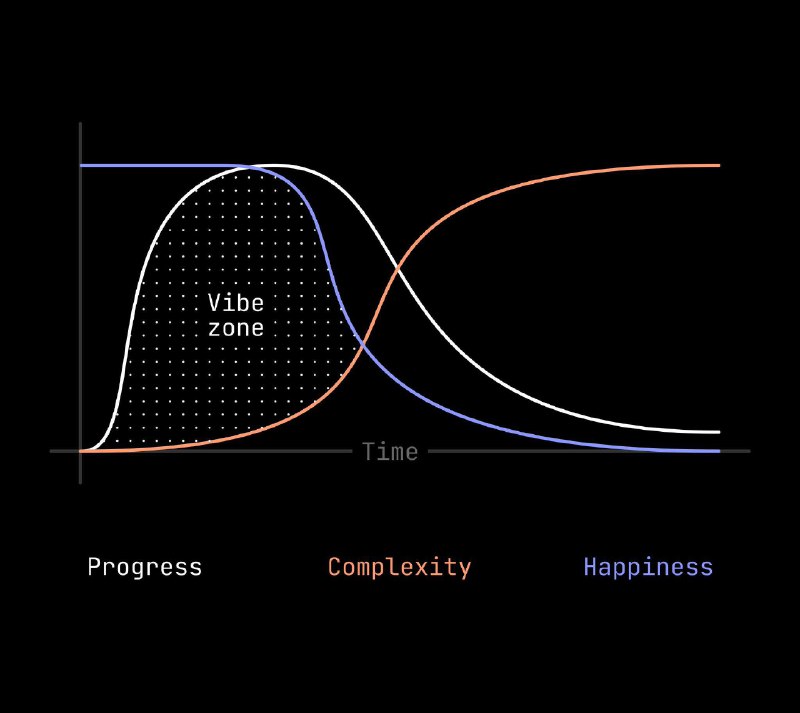
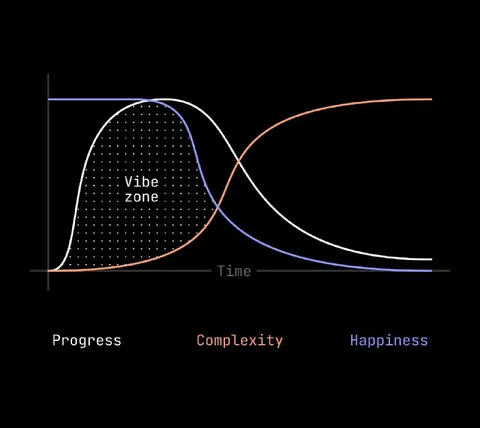
Vibe zone Time Progress Complexity Happiness
A black-background graph shows progress, complexity, and happiness changing over time, with a dotted “Vibe zone” in the middle. The joke is that a person enters a pleasant period where progress and happiness overlap before increasing complexity gradually destroys the good vibes.
line graph / линейный графикwhite curve / белая криваяblue curve / синяя криваяorange curve / оранжевая криваяdotted rectangle / пунктирный прямоугольникtime axis / временная осьblack background / чёрный фонprogress label / подпись «Progress»complexity label / подпись «Complexity»happiness label / подпись «Happiness»
- @dev_meme / 7045 2025-08-15
- Type
- image
- Size
- 800×713 · 41.0 KiB
- Mood
- ironic, relatable
- Language
- en
- Added