Jira Burndown vs Burnout Chart
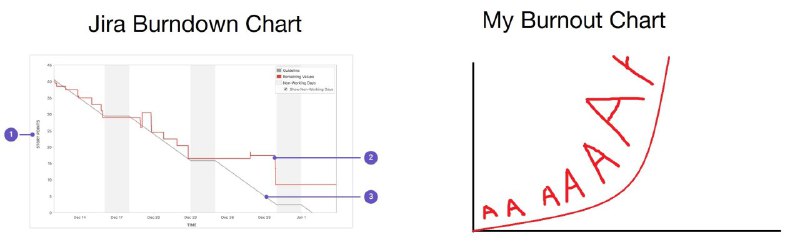
Jira Burndown Chart My Burnout Chart A A AAAA Y
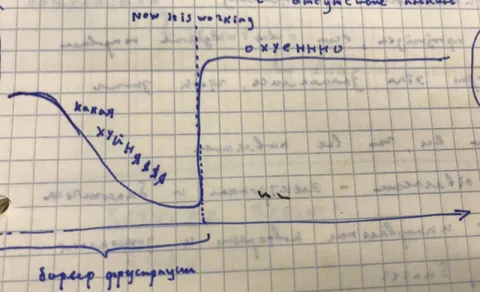
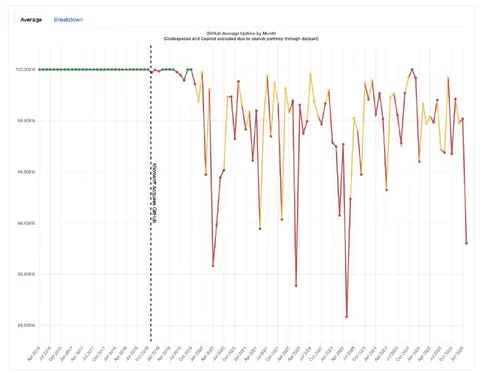
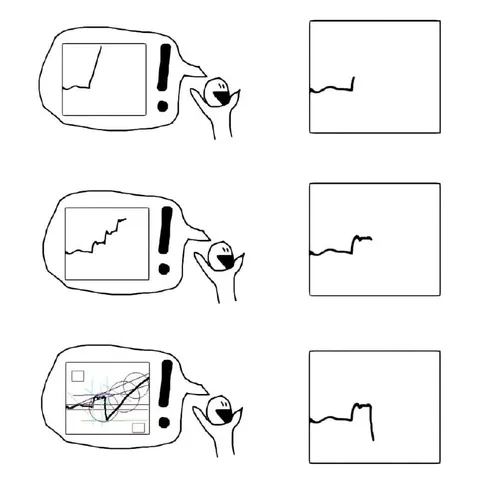
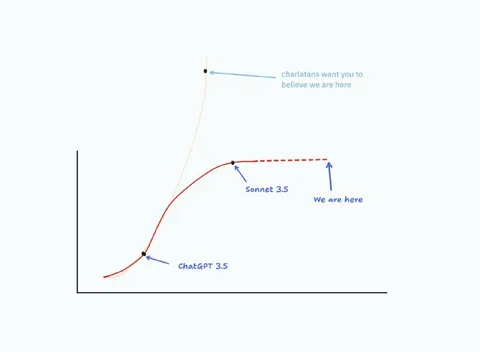
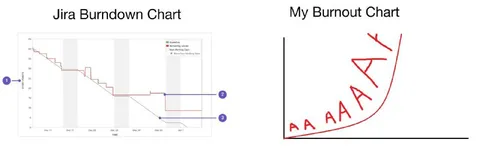
The image contrasts a normal Jira burndown chart with a hand-drawn burnout chart. The Jira graph tracks work decreasing over time, while the burnout graph rises dramatically and ends in a frantic “A A AAAA Y.” The joke is about confusing project-management terminology with personal exhaustion, and it is sent as a reaction to overwhelming work or approaching burnout. EN: The image contrasts a normal Jira burndown chart with a hand-drawn burnout chart. The Jira graph tracks work decreasing over time, while the burnout graph rises dramatically and ends in a frantic “A A AAAA Y.” The joke is about confusing project-management terminology with personal exhaustion, and it is sent as a reaction to overwhelming work or approaching burnout.
computer chart screenshot / скриншот графика на компьютереJira burndown chart / диаграмма сгорания Jirahand-drawn graph / нарисованный от руки графикred line / красная линияpurple numbered markers / фиолетовые маркеры с номерамиaxes / оси координатtime axis / ось времениburnout curve / кривая выгоранияletter A / буква Aletter Y / буква Y
- @profunctor_io / 5507 2020-09-30
- Type
- image
- Size
- 800×247 · 20.4 KiB
- Mood
- саркастичный, абсурдный
- Language
- en
- Added