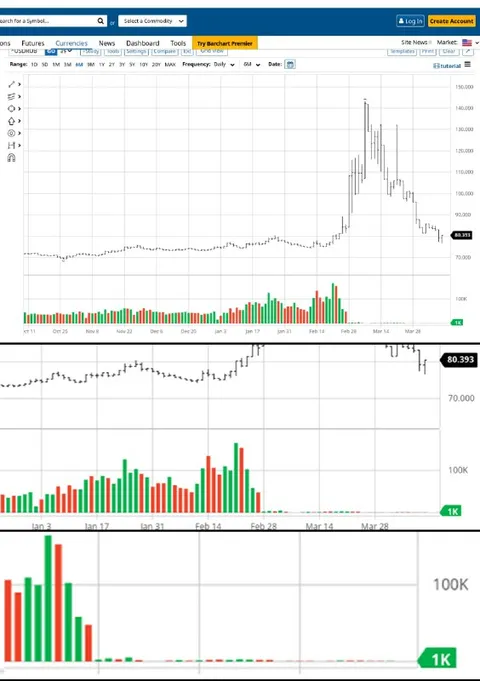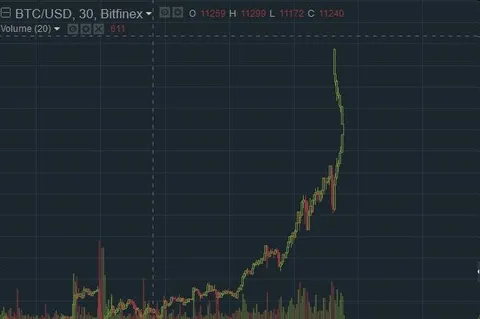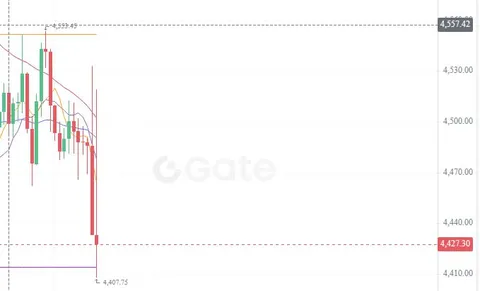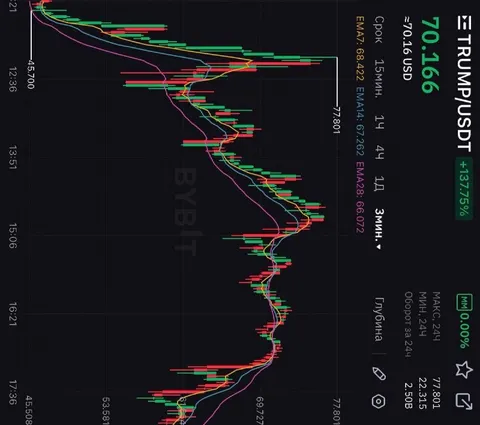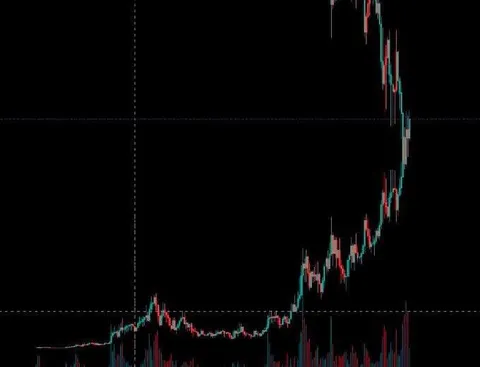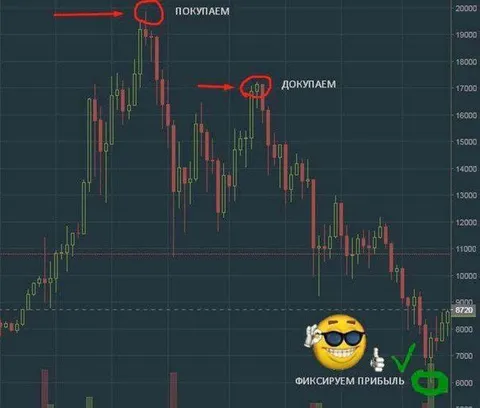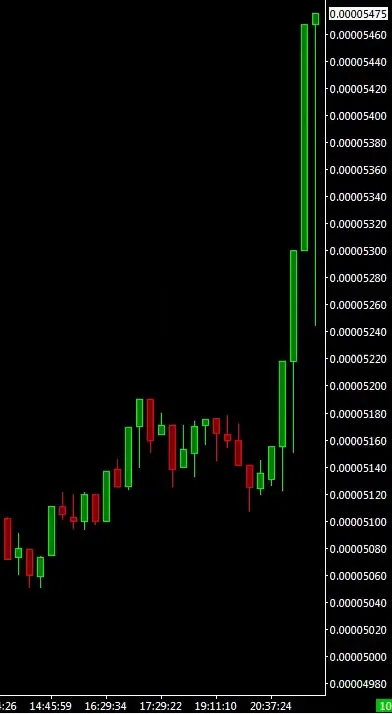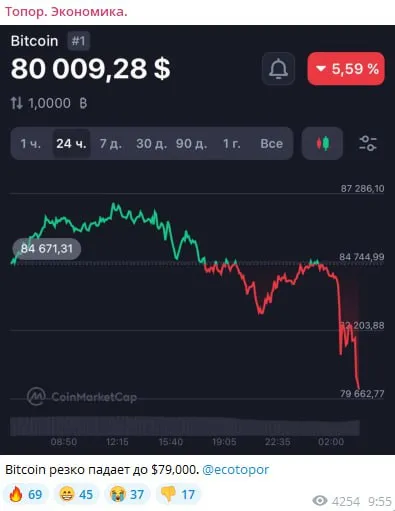
Bitcoin Crash Prediction Chart
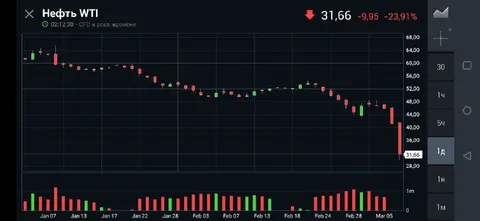
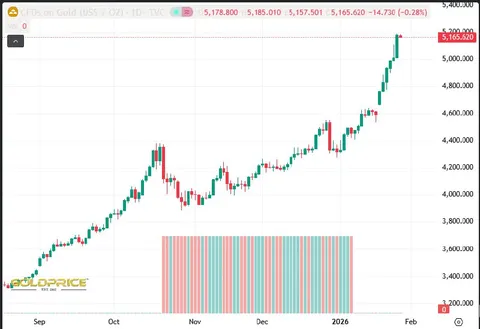
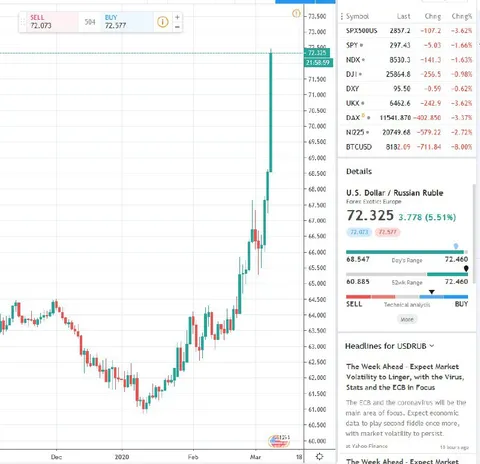
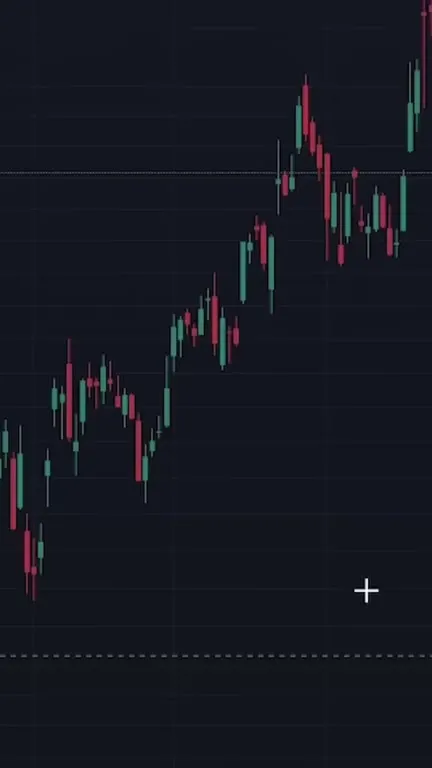
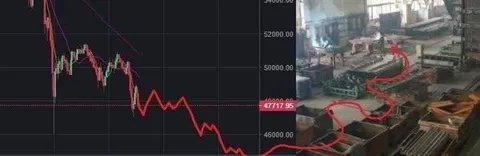
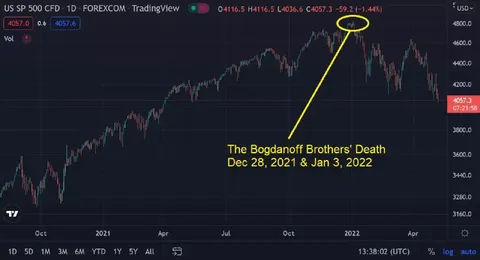
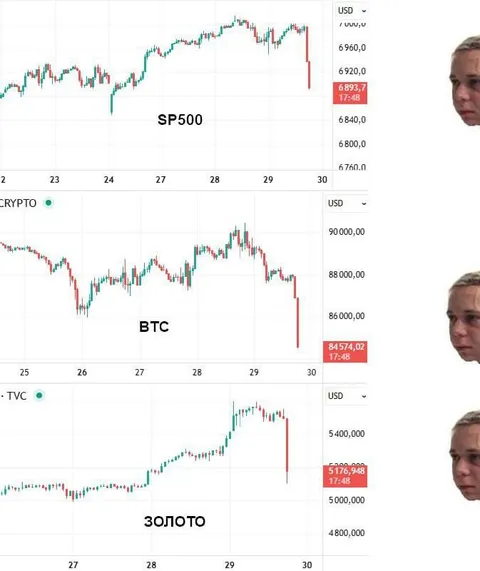
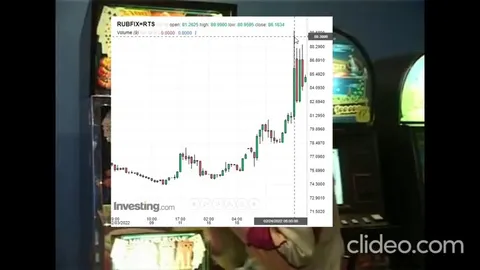
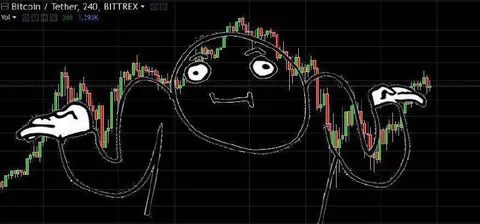
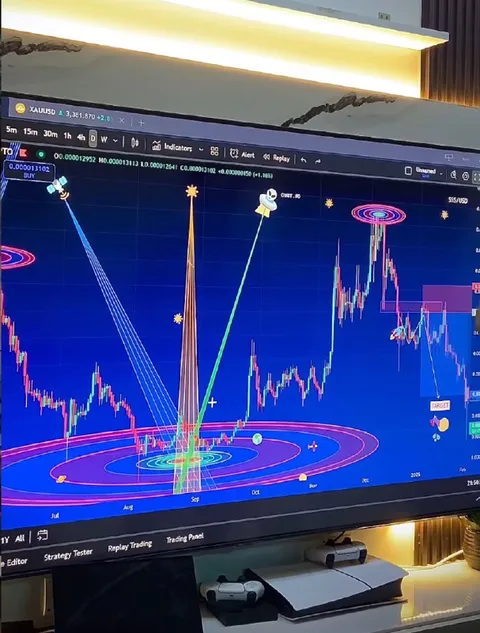
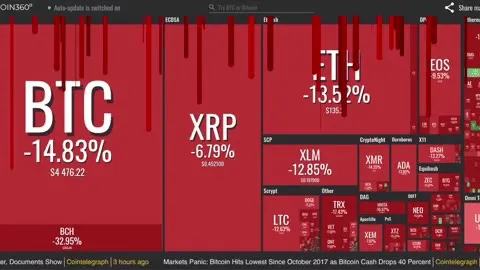
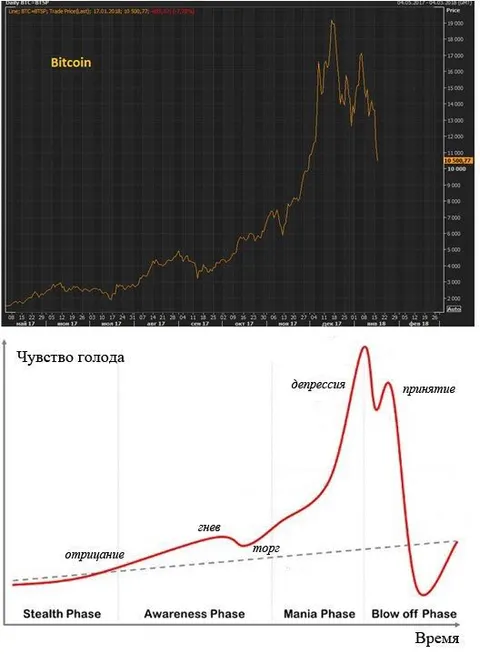
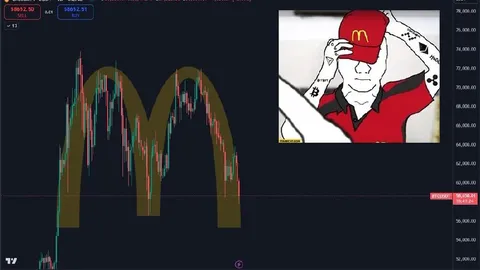
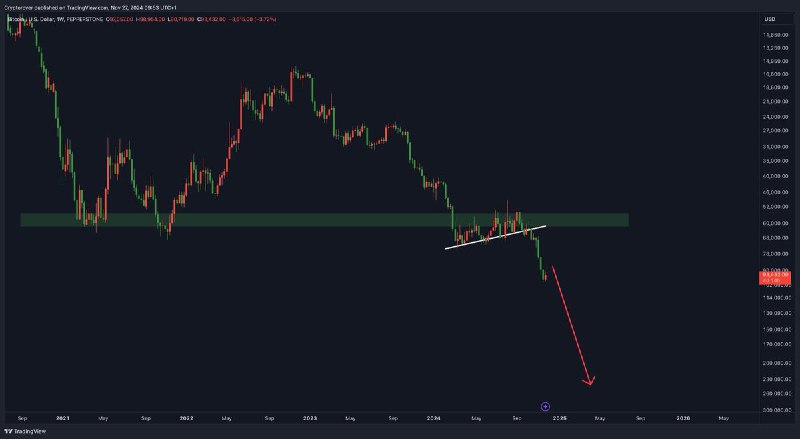
A dark TradingView-style Bitcoin price chart shows a long decline, a brief consolidation near support, and a large red arrow projecting an even steeper crash. The joke is an exaggerated bearish prediction, shared as a reaction to fear, panic, or claims that Bitcoin is about to collapse.
candlestick chart / свечной графикBitcoin price chart / график цены биткоинаred downward arrow / красная стрелка внизgreen support zone / зелёная зона поддержкиwhite trendline / белая линия трендаprice axis / ценовая шкалаtime axis / временная шкалаred candlesticks / красные свечиgreen candlesticks / зелёные свечиdark chart background / тёмный фон графикаTradingView interface / интерфейс TradingView
- @dev_meme / 6434 2024-11-28
- Type
- image
- Size
- 800×439 · 26.6 KiB
- Mood
- sarcastic
- Language
- en
- Added