Jenga Sales Drop in 2002
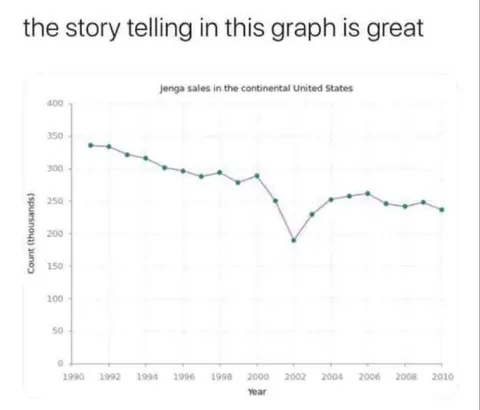
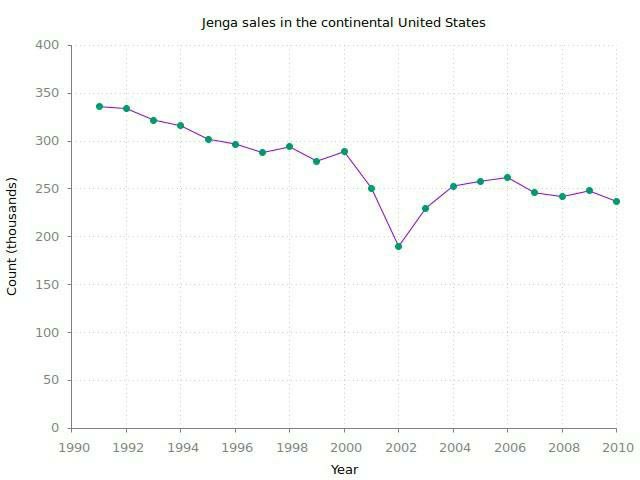
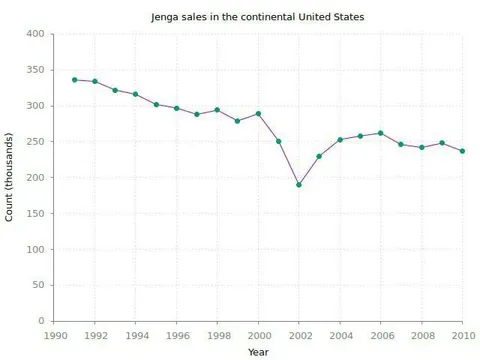
Jenga sales in the continental United States 400 350 300 250 200 150 100 50 0 1990 1992 1994 1996 1998 2000 2002 2004 2006 2008 2010 Count (thousands) Year
A line chart shows Jenga sales in the continental United States from 1991 to 2010, with sales falling sharply around 2002 before partially recovering. The joke is the dramatic unexplained sales dip, presented as a reaction image for a sudden decline or disastrous event. EN: A line chart shows Jenga sales in the continental United States from 1991 to 2010, with sales falling sharply around 2002 before partially recovering. The joke is the dramatic unexplained sales dip, presented as a reaction image for a sudden decline or disastrous event.
- @memetutorial / 10146 2018-01-16
- Type
- image
- Size
- 640×480 · 26.8 KiB
- Mood
- absurd, ironic
- Language
- en
- Added