Itanium Sales Forecasts Versus Reality
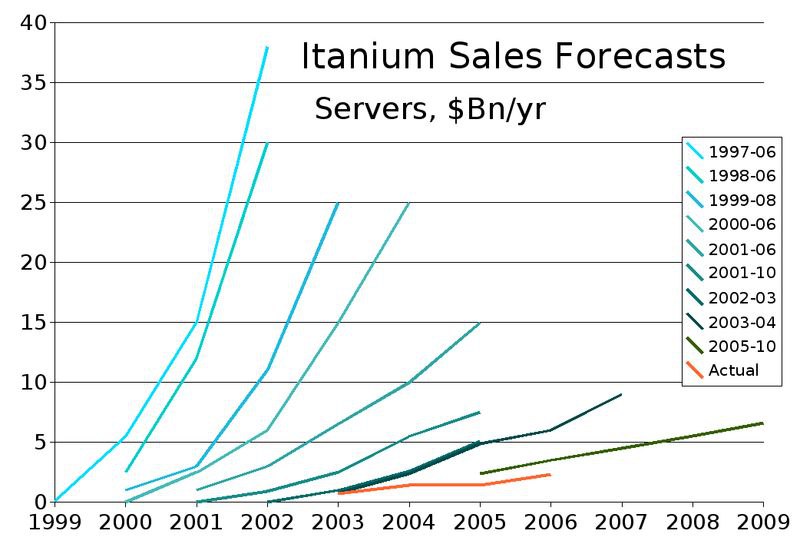
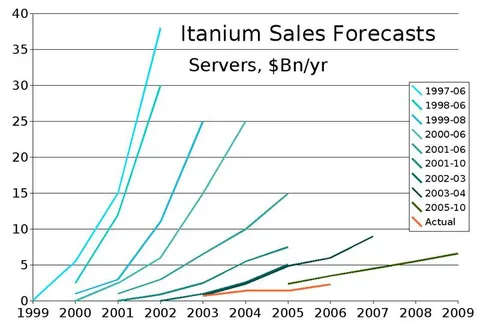
40 35 30 25 20 15 10 5 0 1999 2000 2001 2002 2003 2004 2005 2006 2007 2008 2009 Itanium Sales Forecasts Servers, $Bn/yr 1997-06 1998-06 1999-08 2000-06 2001-06 2001-10 2002-03 2003-04 2005-10 Actual
A line chart titled “Itanium Sales Forecasts” shows successive optimistic predictions for server sales rising dramatically, while the orange “Actual” line stays nearly flat near the bottom. The joke is that repeated forecasts promised explosive growth, but reality barely changed, making it a reaction to unrealistic predictions and failed expectations.
line chart / линейный графикforecast lines / линии прогнозовactual sales line / линия фактических продажgraph axes / оси графикаgrid lines / линии сеткиlegend / легендаserver sales data / данные о продажах серверовyears 1999–2009 / годы 1999–2009turquoise lines / бирюзовые линииorange line / оранжевая линияgreen lines / зелёные линии
- @memetutorial / 18439 2024-06-21
- Type
- image
- Size
- 800×544 · 61.9 KiB
- Mood
- sarcastic, absurd
- Language
- en
- Added