World Oil Inventories Collapse
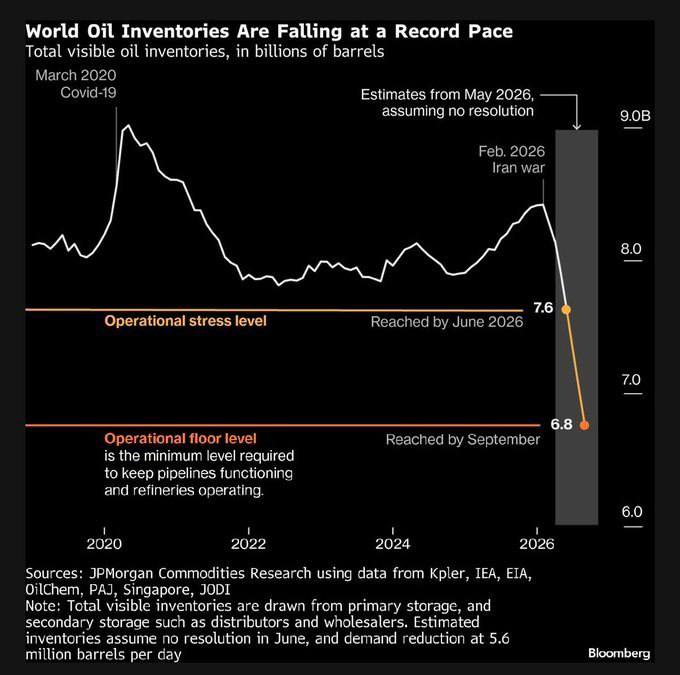
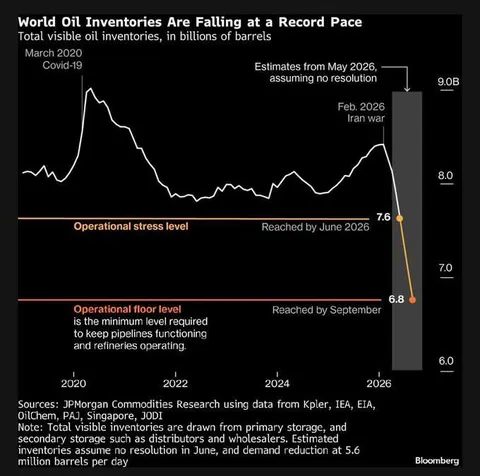
World Oil Inventories Are Falling at a Record Pace Total visible oil inventories, in billions of barrels March 2020 Covid-19 Estimates from May 2026, assuming no resolution Feb. 2026 Iran war 9.0B 8.0 Operational stress level 7.6 Reached by June 2026 7.0 Operational floor level 6.8 Reached by September is the minimum level required to keep pipelines functioning and refineries operating. 6.0 2020 2022 2024 2026 Sources: JPMorgan Commodities Research using data from Kepler, IEA, EIA, OilChem, PAJ, Singapore, JODI Note: Total visible inventories are drawn from primary storage, and secondary storage such as distributors and wholesalers. Estimated inventories assume no resolution in June, and demand reduction at 5.6 million barrels per day
A Bloomberg-style chart shows global visible oil inventories rising during the Covid-19 shock and then falling sharply toward 2026. The joke is the grimly dramatic projection that the Iran war will push inventories below the operational floor, making this useful as a reaction to alarming news or to mock an impending shortage.
line chart / линейный графикoil inventory graph / график запасов нефтиoil barrels / нефтяные баррелиblack background / чёрный фонwhite trend line / белая линия трендаorange projection line / оранжевая прогнозная линияgray forecast area / серая область прогнозаaxis labels / подписи осейstress level marker / отметка уровня стрессаoperational floor marker / отметка операционного минимумаorange data points / оранжевые точки данныхchart source notes / примечания об источниках графика
- @dev_meme / 7986 2026-05-10
- Type
- image
- Size
- 680×675 · 48.9 KiB
- Mood
- anxious, darkly humorous
- Language
- en
- Added