Jenga Sales Graph Tells a Story
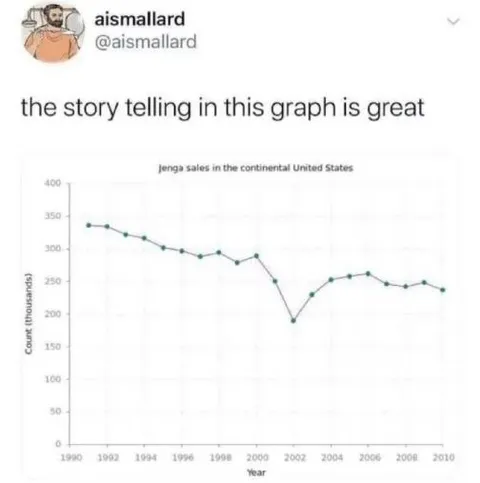
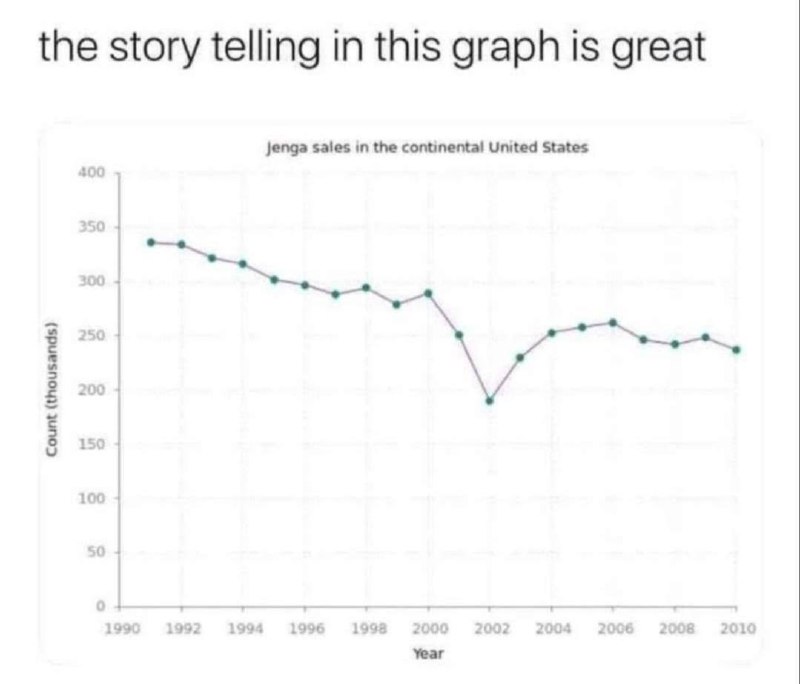
the story telling in this graph is great Jenga sales in the continental United States Count (thousands) Year 1990 1992 1994 1996 1998 2000 2002 2004 2006 2008 2010 400 350 300 250 200 150 100 50 0
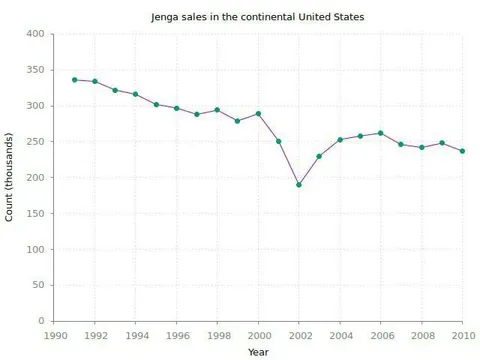
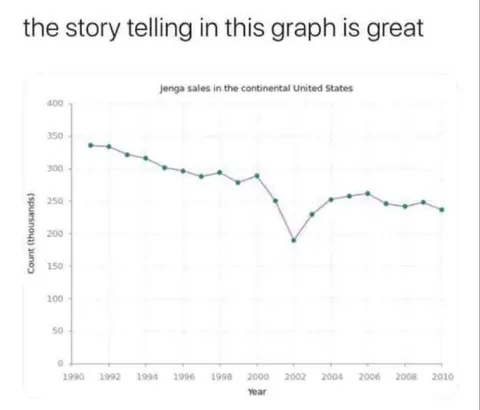
A line graph shows Jenga sales in the continental United States from 1990 to 2010. Sales gradually decline, then plunge sharply around 2002 before partially recovering. The joke is that the graph visually resembles a Jenga tower becoming unstable and collapsing, making the sales trend itself tell a funny story. EN: A line graph shows Jenga sales in the continental United States from 1990 to 2010. Sales gradually decline, then plunge sharply around 2002 before partially recovering. The joke is that the graph visually resembles a Jenga tower becoming unstable and collapsing, making the sales trend itself tell a funny story.
line graph / линейный графикJenga sales data / данные о продажах Jengachart axes / оси графикаgreen data points / зелёные точки данныхdeclining trend line / нисходящая линия трендаsharp drop / резкое падениеpartial recovery / частичное восстановлениеyears 1990–2010 / годы 1990–2010United States / Соединённые Штатыwhite background / белый фон
- @beobanka / 42032 2025-01-14
- Type
- image
- Size
- 800×684 · 36.2 KiB
- Mood
- ироничный, абсурдный
- Language
- en
- Added