Jenga Sales Graph Story
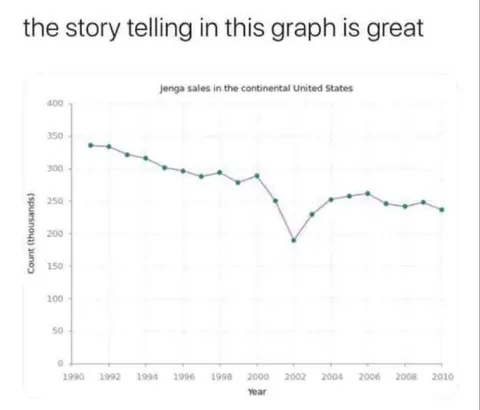
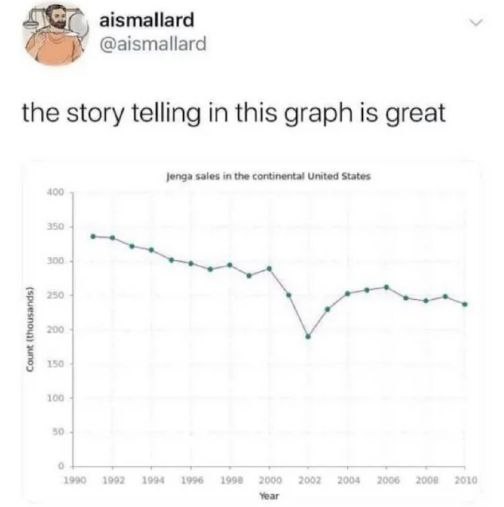
the story telling in this graph is great Jenga sales in the continental United States Count (thousands) Year 1990 1992 1994 1996 1998 2000 2002 2004 2006 2008 2010
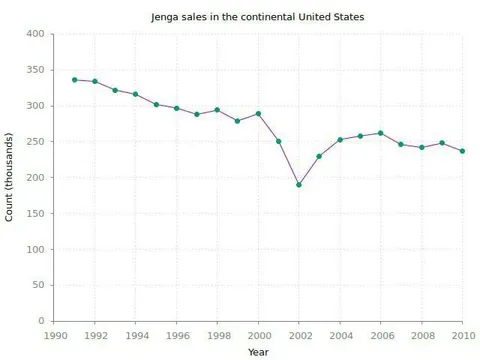
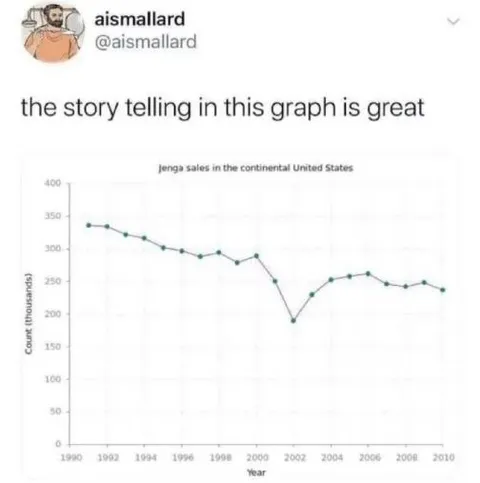
A line graph shows Jenga sales in the continental United States from 1990 to 2010, with a sharp drop around 2001 followed by a partial recovery. The joke is that the graph appears to tell a dramatic story, inviting viewers to imagine what caused the sudden collapse in Jenga sales.
line graph / линейный графикJenga game sales / продажи игры Jengagraph title / заголовок графикаdata points / точки данныхdeclining trend / нисходящий трендsharp drop / резкое падениеrecovery / восстановлениеyears axis / ось летcount axis / ось количестваwhite background / белый фонsocial media post / публикация в соцсети
- @threedotssavetogallery / 3728 2023-10-21
- Type
- image
- Size
- 504×507 · 20.9 KiB
- Mood
- absurd, sarcastic
- Language
- en
- Added