Sloppy Scientist Trolley Problem
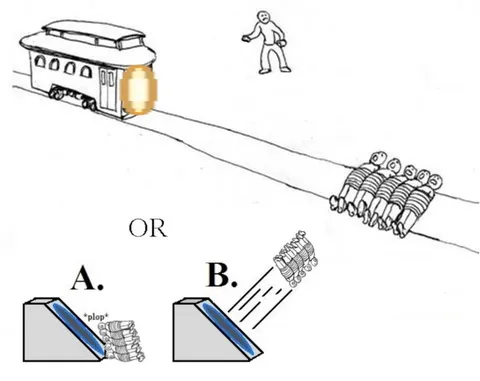
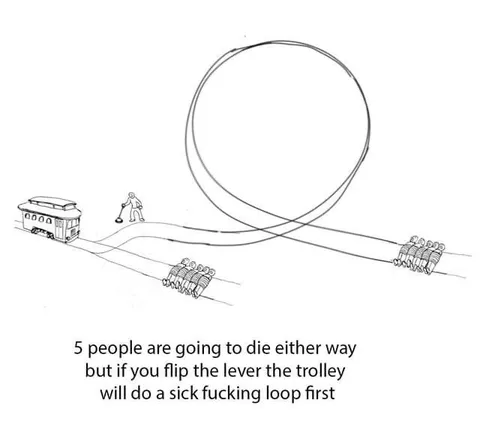
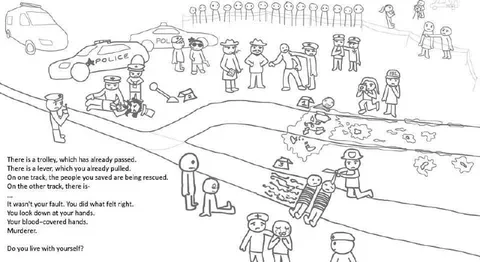
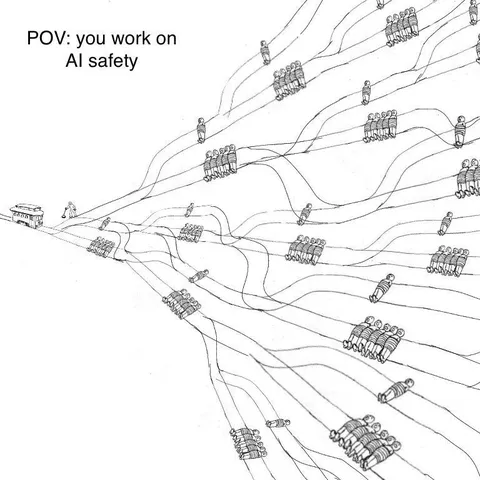
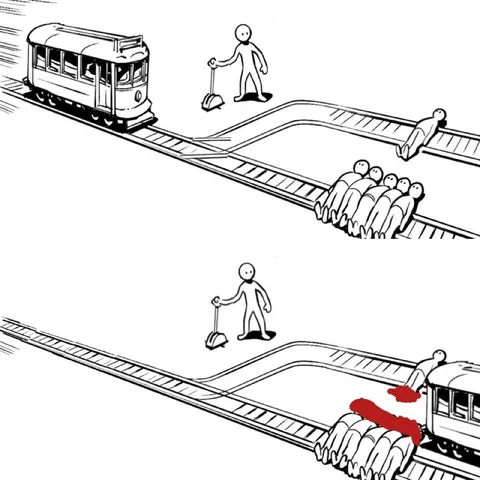
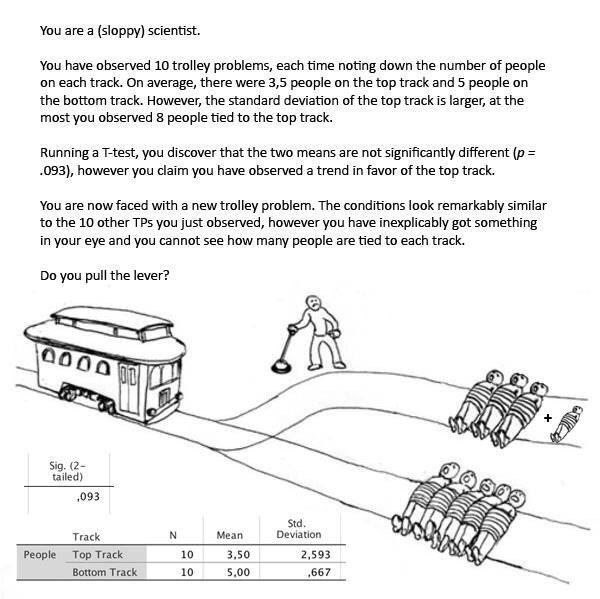
You are a (sloppy) scientist. You have observed 10 trolley problems, each time noting down the number of people on each track. On average, there were 3,5 people on the top track and 5 people on the bottom track. However, the standard deviation of the top track is larger, at the most you observed 8 people tied to the top track. Running a T-test, you discover that the two means are not significantly different (p = .093), however you claim to have observed a trend in favor of the top track. You are now faced with a new trolley problem. The conditions look remarkably similar to the 10 other TPs you just observed, however you have inexplicably got something in your eye and you cannot see how many people are tied to each track. Do you pull the lever? + Fig. (2 – tailed) ,093 Track People Top Track Bottom Track N 10 10 Mean 3,50 5,00 Std. Deviation 2,593 ,667
A sloppy scientist faces a classic trolley problem with people tied to two tracks, but something is in his eye so he cannot see how many people are on each track. The joke mocks careless statistical reasoning: despite a non-significant t-test, he claims a trend and then must make a moral decision without the relevant data. It is sent as a reaction to bad science, questionable methodology, or confidently making decisions while ignoring uncertainty.
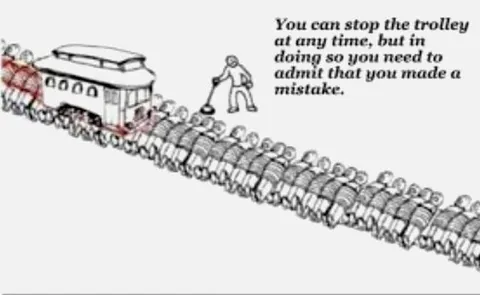
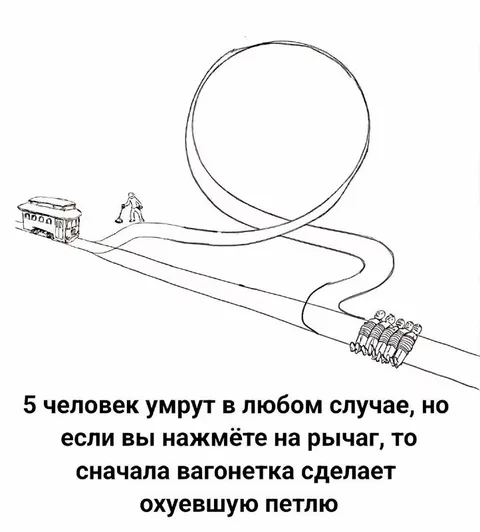
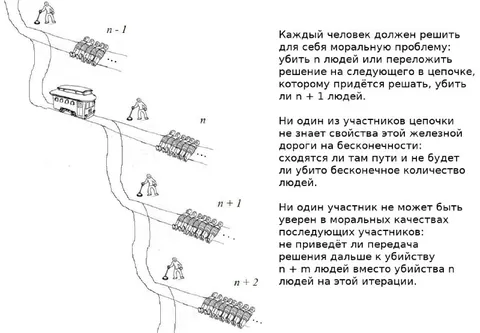
trolley / вагонеткаrailway tracks / железнодорожные путиlever / рычагscientist / учёныйpeople tied to tracks / люди, привязанные к рельсамstriped shirts / полосатые рубашкиsmall person on track / маленький человек на путиeye irritation / раздражение глазаplus sign / знак плюсstatistical table / статистическая таблицаscientific diagram / научная схемаnumbers / числаrailway / железная дорога
- @profunctor_io / 2224 2019-05-17
- @right_wing_dev_squads / 5567 2022-12-23
- @right_wing_dev_squads / 10537 2024-09-23
- Template
- Trolley problem
- Type
- image
- Size
- 600×599 · 66.2 KiB
- Mood
- absurd, sarcastic
- Language
- en
- Added