Poland vs Spain Rape Rate Chart
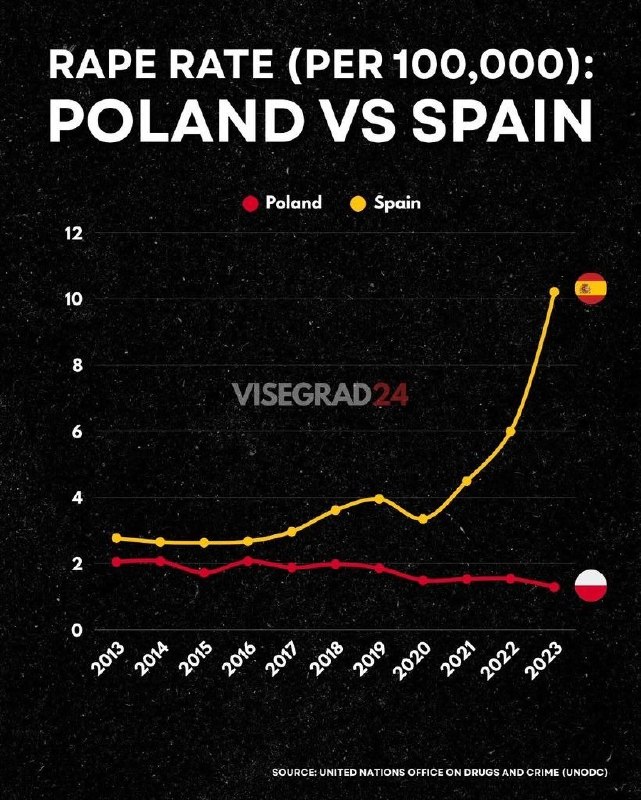
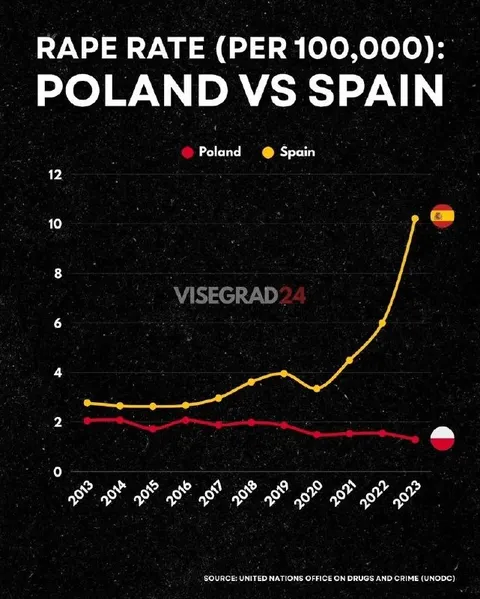
RAPE RATE (PER 100,000): POLAND VS SPAIN Poland Spain 12 10 8 6 4 2 0 2013 2014 2015 2016 2017 2018 2019 2020 2021 2022 2023 SOURCE: UNITED NATIONS OFFICE ON DRUGS AND CRIME (UNODC)
A dark infographic compares rape rates per 100,000 people in Poland and Spain from 2013 to 2023. Spain’s line rises sharply while Poland’s remains low, creating a provocative statistical comparison often shared as a reaction to discussions about crime, safety, and national stereotypes. EN: A dark infographic compares rape rates per 100,000 people in Poland and Spain from 2013 to 2023. Spain’s line rises sharply while Poland’s remains low, creating a provocative statistical comparison often shared as a reaction to discussions about crime, safety, and national stereotypes.
line chart / линейный графикred data line / красная линия данныхyellow data line / жёлтая линия данныхblack background / чёрный фонPolish flag icon / значок польского флагаSpanish flag icon / значок испанского флагаyear labels / подписи годовpercentage scale / шкала показателейlegend / легендаwhite chart grid / белая сетка графикаstatistical infographic / статистическая инфографика
- @proebdolboeba / 126836 2026-05-01
- Type
- image
- Size
- 641×800 · 130.3 KiB
- Mood
- provocative, shocking
- Language
- en
- Added