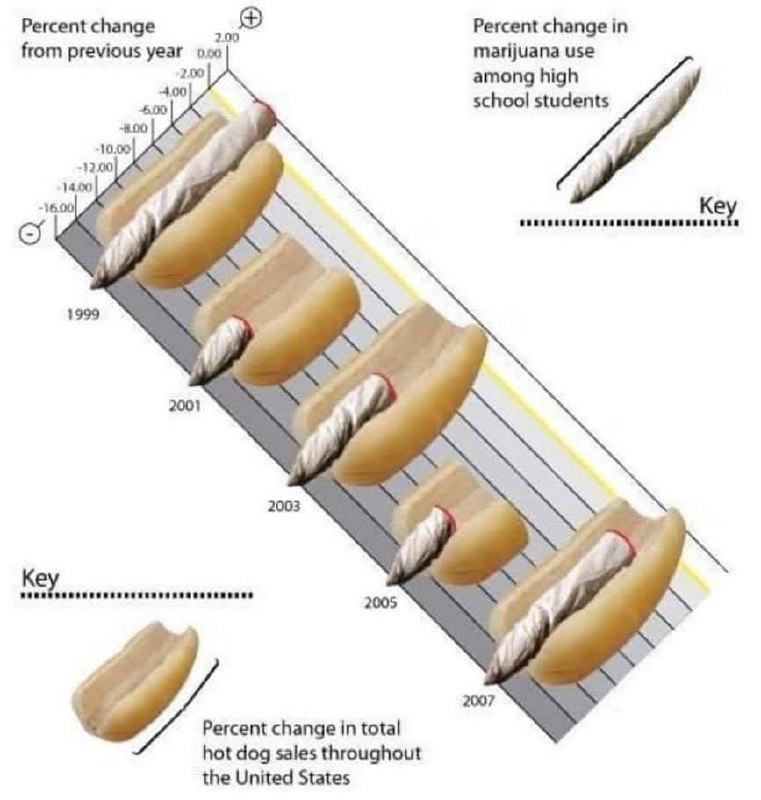
Marijuana and Hot Dog Correlation Chart
Percent change from previous year 2.00 0.00 -2.00 -4.00 -6.00 -8.00 -10.00 -12.00 -14.00 -16.00 1999 2001 2003 2005 2007 Percent change in marijuana use among high school students Key Percent change in total hot dog sales throughout the United States
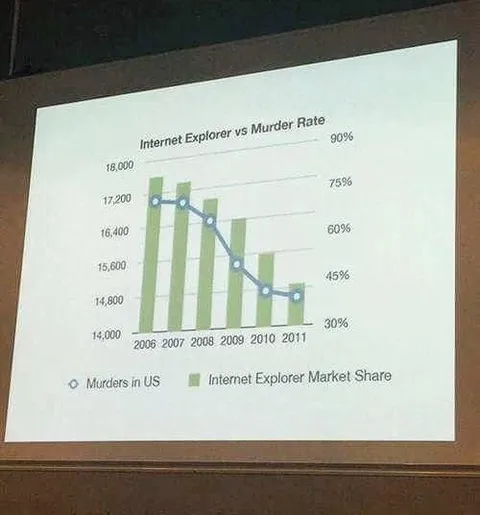
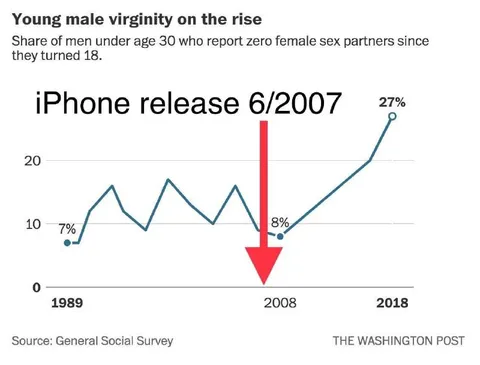
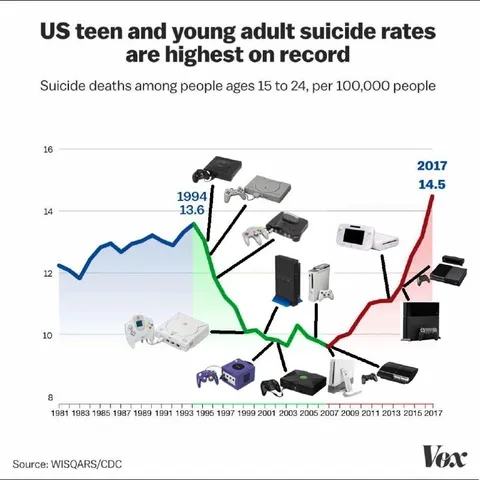
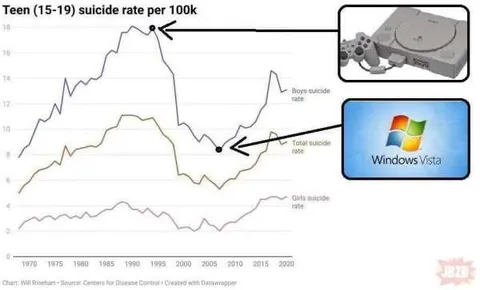
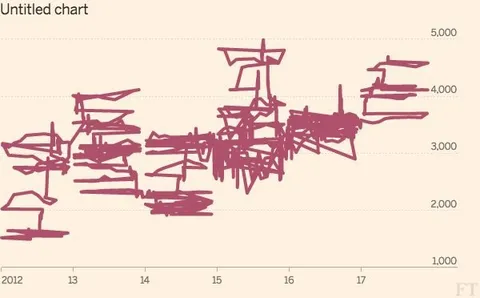
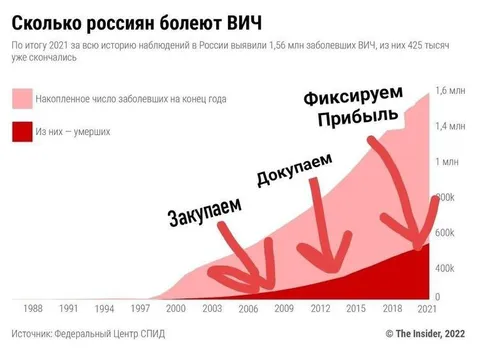
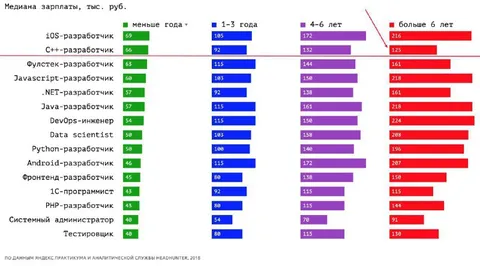
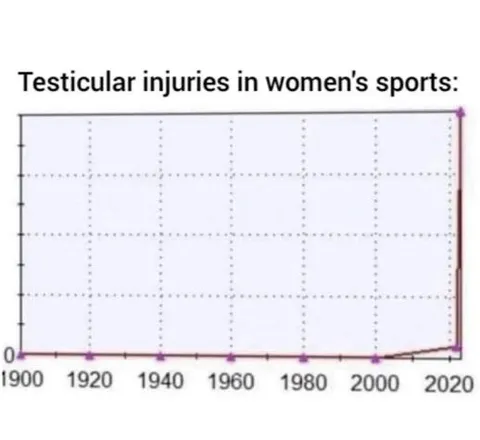
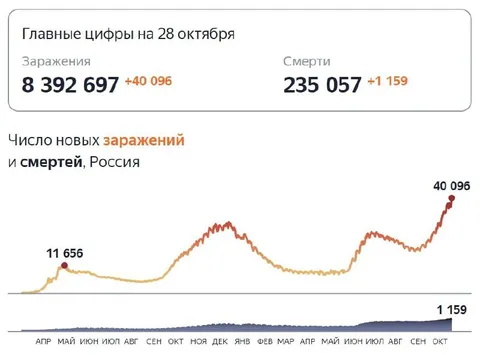
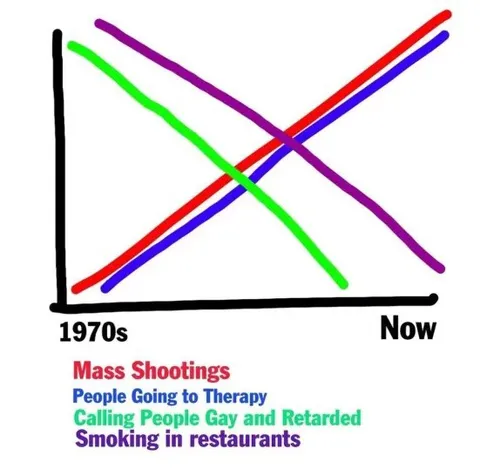
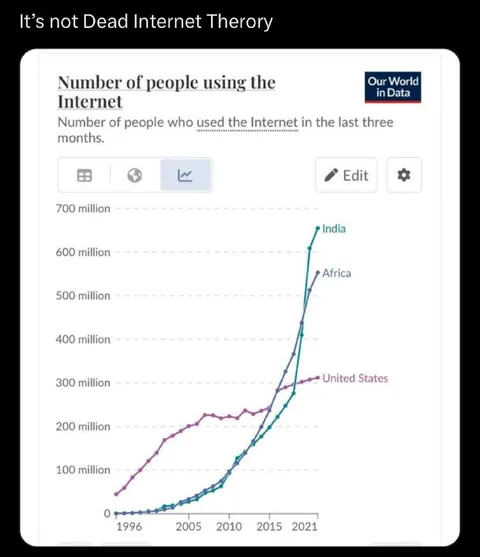
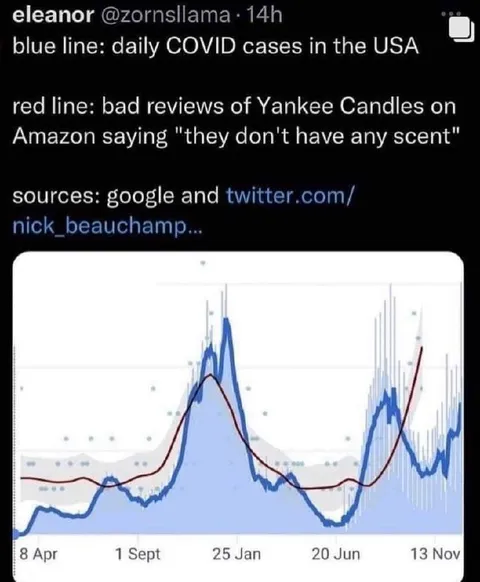
A humorous 3D chart compares changes in marijuana use among high school students with changes in total hot dog sales in the United States from 1999 to 2007. Hot dogs and marijuana joints are used as chart markers, creating the absurd impression that the two trends are related. It is sent as a reaction to misleading statistics, spurious correlations, or overcomplicated infographics.
- @rzeczyzabawne / 21379 2025-08-30
- Type
- image
- Size
- 761×800 · 76.5 KiB
- Mood
- absurd, sarcastic
- Language
- en
- Added