U.S. Heat Wave Index
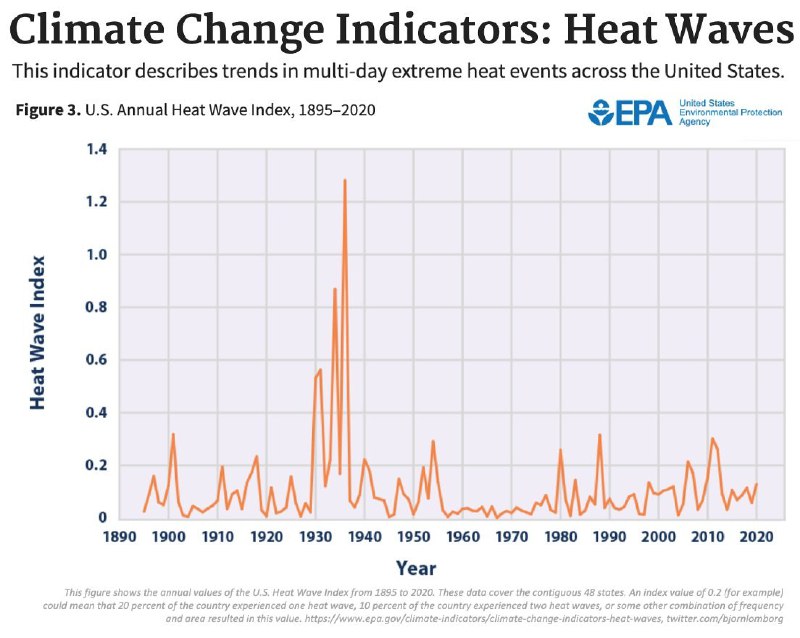
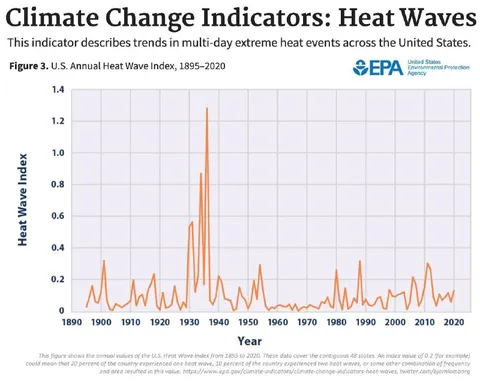
Climate Change Indicators: Heat Waves This indicator describes trends in multi-day extreme heat events across the United States. Figure 3. U.S. Annual Heat Wave Index, 1895–2020 EPA United States Environmental Protection Agency Heat Wave Index 1890 1900 1910 1920 1930 1940 1950 1960 1970 1980 1990 2000 2010 2020 Year This figure shows the annual values of the U.S. Heat Wave Index from 1895 to 2020. These data cover the contiguous 48 states. An index value of 0.2 (for example) could mean that 20 percent of the days within the country experienced a heat wave, 10 percent of the country experienced a heat wave, or some other combination of frequency and area resulted in this value. https://www.epa.gov/climate-indicators/climate-change-indicators-heat-waves, twitter.com/bjornlomborg
График EPA показывает годовой индекс волн жары в США с 1895 по 2020 год. Пик приходится на 1930-е годы, а после 1960 года значения в основном значительно ниже. В контексте публикации график используется саркастически, чтобы поставить под сомнение распространённое представление о постоянном усилении экстремальной жары и высмеять выборочную подачу статистики. EN: An EPA chart shows the annual U.S. Heat Wave Index from 1895 to 2020. The peak occurs in the 1930s, while values after 1960 are mostly much lower. In the context of the post, the chart is used sarcastically to challenge the common narrative of steadily worsening extreme heat and mock selective presentation of statistics.
- @dustinthehead / 3468 2021-08-19
- Type
- image
- Size
- 800×638 · 77.6 KiB
- Mood
- саркастичный, полемичный
- Language
- en
- Added