AI Benchmark Comparison Table
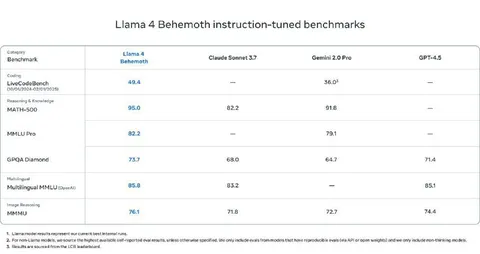
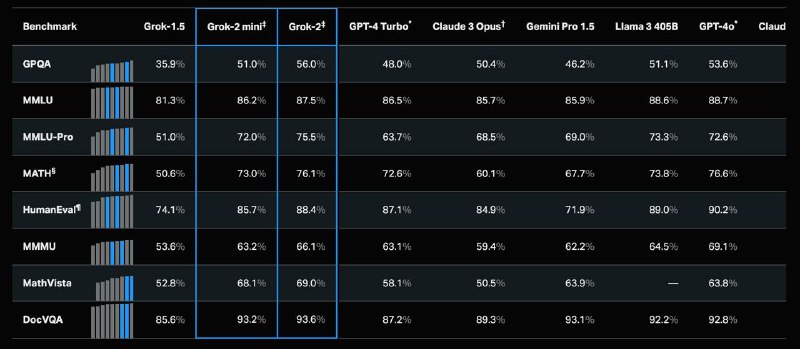
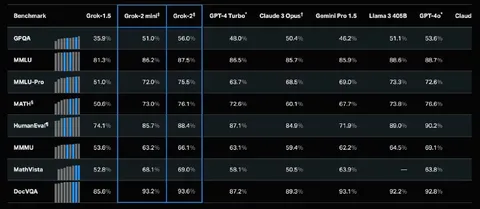
Benchmark Grok-1.5 Grok-2 mini† Grok-2‡ GPT-4 Turbo° Claude 3 Opus† Gemini Pro 1.5 Llama 3 405B GPT-4o° Claud GPQA 35.9% 51.0% 56.0% 48.0% 50.4% 46.2% 51.1% 53.6% MMLU 81.3% 86.2% 87.5% 86.5% 85.7% 85.9% 88.6% 88.7% MMLU-Pro 51.0% 72.0% 75.5% 63.7% 68.5% 69.0% 73.3% 72.6% MATH§ 50.6% 73.0% 76.1% 72.6% 60.1% 67.7% 73.8% 76.6% HumanEval¶ 74.1% 85.7% 88.4% 87.1% 84.9% 71.9% 89.0% 90.2% MMMU 53.6% 63.2% 66.1% 63.1% 59.4% 62.2% 64.5% 69.1% MathVista 52.8% 68.1% 69.0% 58.1% 50.5% 63.9% — 63.8% DocVQA 85.6% 93.2% 93.6% 87.2% 89.3% 93.1% 92.2% 92.8%
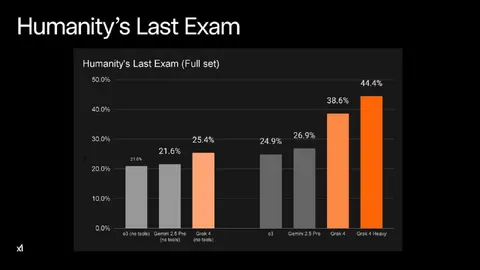
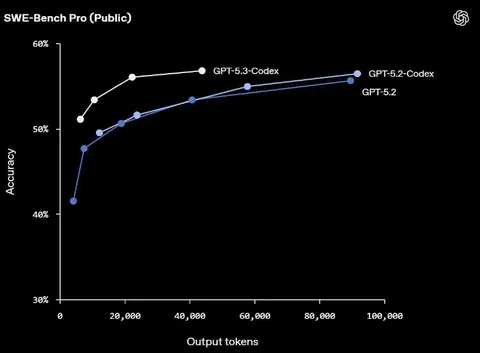
A dark benchmark comparison table shows performance percentages for several AI models across tasks including GPQA, MMLU, MATH, HumanEval, MMMU, MathVista, and DocVQA. The joke is that the chart visually contradicts the attached claim that Claude 3.5 is still better at almost everything, since Claude is only one of several models shown and does not lead every benchmark.
benchmark table / таблица бенчмарковAI model names / названия моделей ИИpercentage scores / процентные показателиdark background / тёмный фонblue highlighted columns / выделенные синим столбцыgray bar indicators / серые индикаторы в виде полосrow labels / названия строкwhite text / белый текстblack grid lines / чёрные линии сетки
- @dev_meme / 6154 2024-08-14
- Type
- image
- Size
- 800×349 · 49.5 KiB
- Mood
- sarcastic
- Language
- en
- Added